Measuring Video ROI for Startup Marketing Teams
Startups often lack the metrics to prove if videos actually drive revenue, not just views.

Summary
Startups often lack the metrics to prove if videos actually drive revenue, not just views.
91% of businesses use video for marketing in 2026. Fine, that's not news anymore, that's just Tuesday. What's actually worth stopping on: only 36% of marketers say they can accurately measure content ROI. Almost everybody's filming something, yet fewer than four in ten of them know if it did a damn thing.
That gap is the whole story, or close to it. When a team tells you "we can't measure ROI," they usually mean something narrower: they're staring at view counts and likes, calling it a metric, and hoping nobody in the boardroom asks a follow-up. Sometimes there's a genuine attribution gap, sure, that part's real. But more often it's three mistakes wearing a trench coat and pretending to be one problem: wrong metric for the funnel stage, comparing video to text on a time horizon that makes no sense, and lumping a brand film, a demo, and an onboarding tutorial into one undifferentiated blob called "content."
None of this is a tooling problem, by the way. You could buy every analytics platform on the market and still botch the measurement, because the mistake happens before anyone opens a dashboard. It happens the moment you slap the same KPI on a top-of-funnel brand film and a bottom-funnel demo video, then wonder why neither number makes sense. What follows is a way to match the metric to the stage, so each video gets judged by a standard it can actually clear.
What video ROI actually means before you pick a single metric
The formula from marketing 101 still holds: (revenue attributed to video minus total cost) divided by total cost, times 100. Spend $15,000, generate $60,000 in trackable revenue, and you've got a 300% ROI. Clean, simple, great on a slide.
The mess lives in the inputs. Cost gets underreported constantly, because "video cost" quietly shrinks down to "what we paid the production company" and stops there. Real cost includes distribution spend, software subscriptions, and the hours you spent scripting, reviewing, and approving cuts. Skip those and your ROI number is fiction wearing a lab coat.
Revenue attribution is the harder half, and it forces a decision most teams dodge: which attribution model are you actually using? First touch, last touch, something split down the middle? You can't fill in the numerator until you've picked a lane, and picking a lane means admitting that some revenue credit is a judgment call, not a fact pulled off a dashboard.
There's a second variable tangled in here too. What kind of video is it, awareness, conversion, or retention, because that answers which revenue you can honestly claim and over what window. A brand awareness video from March doesn't get full credit for a deal that closes in October just because the prospect watched it once back in spring. Maybe it earns a sliver of credit, not the whole thing.
Worth flagging: 82% of video marketers report good ROI from their programs, and that number is almost entirely self-reported. Treat it as a temperature check, not something you build a budget request on. Everything below is built for honest, defensible numbers, not the kind that look great in a survey and dissolve the second someone asks a follow-up question.
How the funnel stage changes what a video is actually supposed to do
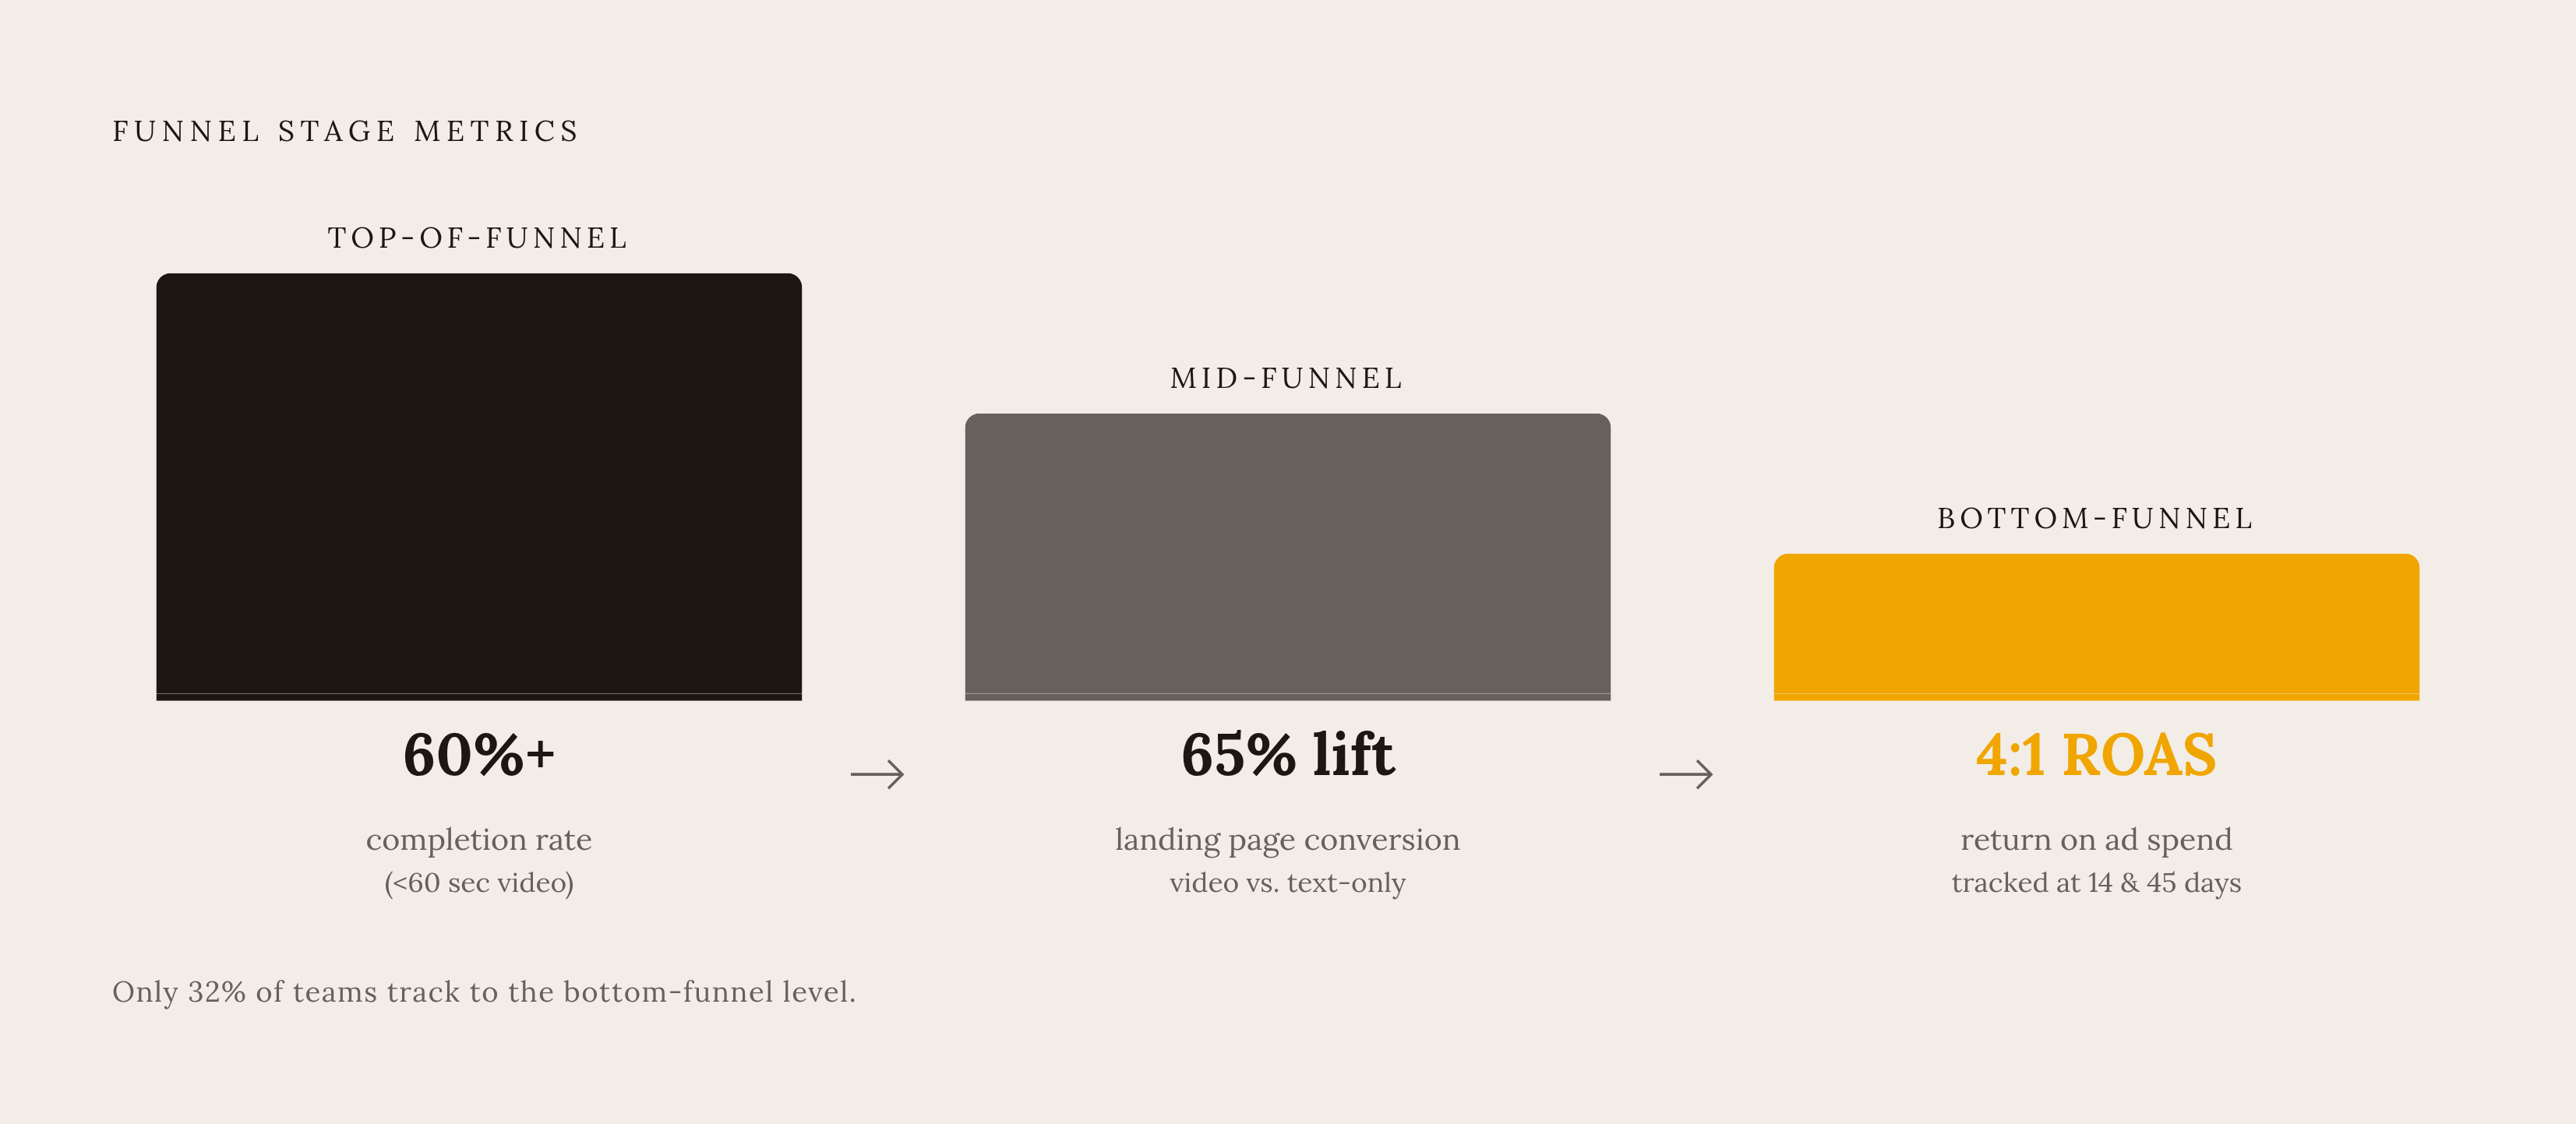
Video has three different jobs depending on where it sits. Top-of-funnel builds reach and category awareness, mid-funnel educates and qualifies, and bottom-funnel converts and closes. Different jobs, different scorecards, and yet somehow everyone keeps grading with the same rubric.
A brand film isn't failing because it didn't generate leads; generating leads was never its assignment. A demo video that racks up views but produces zero booked meetings isn't succeeding either, no matter how good the thumbnail looks. Judging both against "did it make money" is like timing a marathon runner and a sprinter with the same stopwatch split and acting shocked when the numbers don't match.
B2B SaaS makes this worse, since buying cycles stretch across months, sometimes past a year, with a handful of people weighing in on the decision. A single explainer video might do top-of-funnel work for the VP who just discovered your category, and bottom-funnel work, at the same time, for the champion trying to sell procurement on the idea. Same video, but two different jobs, depending on who's watching it.
Define the job before you pick a metric. Who's meant to see this, at what point in their journey, and what's the one next action you want out of them? Think of it as a job description for the video. If you can't answer that in a single sentence, you're not ready to measure anything yet, and no dashboard will save you from that.
Here's the part that should temper everyone's expectations a bit: research keeps showing that most of the B2B buyer journey happens in the dark, before anyone fills out a form or picks up a phone. Awareness video ROI stays partly invisible forever, not because your tracking is broken, but because a huge chunk of your audience never leaves a trace worth following. Different stages need different standards of evidence, and one ROI number covering the entire video program is a tidy idea that falls apart on contact with reality.
Metrics that honestly measure top-of-funnel video
At the top, the right question isn't "did this make money." It's "did this reach the right people and hold their attention for a beat." Revenue is three steps and several months out, while attention you can check today.
Raw view counts lie to you across platforms, and this trips up more teams than it should. YouTube counts a view at 30 seconds, while Facebook counts one at 3 seconds. Comparing "views" across the two without normalizing is like comparing your commute to a friend's and forgetting you measured in minutes while she measured in miles.
Completion rate is the better proxy. For anything under 60 seconds, aim for 60% completion or better. For one-to-three minute videos, 40 to 60% is a solid result. Fall below that and people are clicking away before you've said anything worth remembering.
66% of video marketers lean on engagement (likes, shares, reposts) to gauge ROI, and 62% lean on views. Those are the two most common metrics in the industry, and that's exactly the problem: they measure activity, not audience quality. A video can rack up shares from people who will never buy anything from you, ever, and still look fantastic on a dashboard.
What actually belongs in a top-of-funnel report: share of your ideal customer profile reached (impression share among your real target on paid campaigns), branded search lift over the campaign window, and the offhand stuff sales reps mention almost in passing, "hey, a couple prospects brought that video up unprompted." Cost-per-view on broad paid placements, TikTok and Instagram included, runs $0.02 to $0.04, a fine efficiency check, though it means nothing if you're reaching the wrong audience cheaply.
Say the limitation out loud instead of hiding it: awareness ROI carries permanent uncertainty. The goal isn't manufacturing false precision. It's picking a proxy you can defend in a room full of skeptics, and admitting, plainly, that it's a proxy.
Metrics that honestly measure mid-funnel video
Mid-funnel video has one job: cut friction and move an already-interested prospect toward the next step. You're measuring a pipeline event, not a sale. Checking your bank account after publishing a mid-funnel explainer is checking the wrong thing at the wrong moment.
Click-through rate to the next step and conversion rate on the page hosting the video are the two most defensible mid-funnel numbers. Landing pages with embedded video convert at roughly 65% higher rates than text-only pages; for B2B SaaS explainer placements specifically, controlled testing has shown lifts north of 100%. That's not a rounding error, but a full page redesign's worth of lift, just from bolting on a video.
For gated video assets, the ones sitting behind an email form, a 5 to 10% conversion rate is a reasonable target for a well-targeted campaign. Anything way above that deserves a second look, because it might just mean your gate is too easy, not that your video is unusually persuasive.
Pipeline influence matters, but it's trickier. B2B companies report, on average, that video influences over 40% of the sales pipeline, per Demand Gen Report. The hard part isn't the number; it's isolating video's slice of credit from the other five touches that same prospect had along the way. A practical fix: run a video hosting platform like Wistia or Vidyard that passes viewer-level data straight into your CRM, then compare pipeline velocity and average deal size between contacts who watched and contacts who didn't. That comparison, run inside your own pipeline, beats any industry benchmark you'll dig up.
One more mid-funnel number that quietly earns its keep: 57% of video marketers say video has cut down support queries. For onboarding and tutorial content, that's a direct cost offset, real support hours saved, and it belongs in your ROI math even though almost nobody remembers to put it there.
Metrics that honestly measure bottom-funnel video
Bottom-funnel video has the clearest job of the three: convert a prospect who's already sales-qualified. Demo walkthroughs, testimonials, case study breakdowns, personalized outreach clips, they all live here. This is also where measurement gets the most tractable, and where the biggest edge sits waiting for whoever bothers to pick it up.
Only 32% of teams track performance down to this level of granularity. That is a low bar, and clearing it gives you a real competitive advantage, not a participation trophy.
83% of video marketers say video has directly increased sales, but that figure is self-reported, so file it under vibe check, not target. The honest version of that claim means tying a specific video touchpoint to a specific closed deal inside your CRM, not just a general sense that video "helps," whatever that means.
For outreach sequences that include video, track reply rate, meeting-booked rate, and opportunity-to-close rate, then stack that against sequences without video. Running that comparison inside your own pipeline beats any vendor-published benchmark, because it controls for your actual audience, your actual reps, your actual product.
For paid bottom-funnel campaigns, ROAS (return on ad spend) is the number that matters. A 4:1 ROAS means four dollars back for every dollar spent. Model this before you commit budget, using these inputs: impressions, view-through rate, click-through rate, conversion rate, and average deal size. LinkedIn CPMs for competitive B2B tech audiences run 50 to 100% higher than broader platforms, so the math only works if your deal size and close rate can absorb that premium. Skip bottom-funnel LinkedIn video for a $200 product, because the CPM will eat you alive before lunch.
The most common mistake at this stage is crediting the entire closed deal to whichever video the buyer happened to watch last. Bottom-funnel video usually closes deals that were already in motion, and contribution credit is the accurate frame, while full attribution is just the flattering one.
Why attribution breaks in B2B SaaS and what to do about it on a limited budget
The attribution problem isn't a bug you patch with better software. It's structural. Multiple decision-makers, long sales cycles, and most of the buyer journey happening somewhere your pixels can't reach: no tool fixes that, because the tool was never the problem.
Last-touch attribution makes it worse by design. It hands full credit to whatever the prospect clicked right before converting and ignores every piece of awareness and education content that made that click possible in the first place. That's giving the field goal kicker credit for the whole drive.
For B2B SaaS with a moderate sales cycle and several touchpoints, position-based attribution, a model that gives heavier credit to the first and last touch, with lighter credit in the middle, is a more honest starting point than last-touch. It is not perfect, just less wrong.
Browser privacy changes and iOS tracking restrictions have made client-side data noisier over the past few years, which pushes self-reported pipeline surveys and CRM-matched viewer data further up the priority list, not as a nice-to-have, but as a real complement to whatever pixel data survives. Free tools carry you further than most people expect: GA4 for conversion path reporting, HubSpot's free CRM tier for basic first and last-touch tracking, Dreamdata's free plan if you're a solo marketer trying to piece the picture together. None of that is perfect attribution, but at this budget, consistent tracking beats perfect tracking, mostly because perfect tracking doesn't exist and consistent tracking does.
When you present this to leadership, present a range, not a point estimate. "This video program likely generated between $40,000 and $70,000 in influenced pipeline, assuming X attribution model" lands better, and holds up longer, than a single confident number secretly built on sand.
Building a measurement stack on a startup video budget
Reality check on budget: nearly 40% of companies spend under $5,000 producing videos, and 41% spend under $20,000 promoting them. Most startup video programs are small and scrappy, not Super Bowl money. If your program looks tiny next to the case studies you read, that's not a sign you're doing it wrong, just the median.
AI production tools have knocked costs down meaningfully over the past couple years. Work that used to need a full crew and a rented studio now happens for a fraction of the price, freeing up money that used to be locked into production and can now go toward promotion or measurement instead.
Here's where teams shoot themselves in the foot: they blow the whole budget making the video look good and leave nothing for tracking it afterward. No framework, this one included, works without infrastructure to feed it data.
A minimum viable stack looks like this: a video hosting platform that passes viewer data into your CRM (entry-level Wistia or Vidyard pricing works fine), strict UTM tagging on every video link you publish, and one clearly defined conversion event per video, decided before it goes live, not scrambled together after.
That last point is the most common measurement mistake in the industry, full stop. Teams publish, then scramble weeks later trying to figure out what "success" was even supposed to look like. Decide the metric at the planning stage, match it to the funnel stage, and lock it before the video is public.
Nobody talks about this enough: consistent tracking compounds. When you measure ten videos the same way, even imperfectly, you build your own internal benchmark, one more useful than any industry stat because it's built from your actual audience and your actual product. That internal comparison ends up being the most credible evidence you'll ever have.
What a stage-matched measurement review actually looks like in practice
This isn't a dashboard you glance at once a month and nod along to. It's a structured question, asked on a schedule, with a real answer expected: did this video do the job it was hired for, judged by the metric assigned to its stage before it ever went live?
For every video in the program, the review answers three things: what stage it was built for, what metric got pre-assigned to it, and what the actual evidence says, including drawing a hard line between "we genuinely can't measure this yet" and "we measured it, and it fell short." Those two outcomes look nothing alike on paper, and get treated as identical far too often.
Which brings up the zero problem. A video with no measurable impact needs an explanation, because whether tracking broke or the video actually failed to land changes the entire conversation. Those two scenarios must never look the same in a report; if they do, nobody trusts a single number in that report again.
On timing: review top-of-funnel videos at 30 and 90 days, since awareness signals take longer to surface. Review mid- and bottom-funnel videos at 14 and 45 days, since conversion signals show up faster and there's no upside in waiting around for them.
When a video underperforms, resist the urge to yank it immediately. Check whether distribution actually hit the right audience, whether the intended viewer even saw it, and whether the conversion action was obvious to a first-time viewer. Most "bad" videos aren't bad, they're decent videos shown to the wrong people, or asked to do something the viewer never quite understood.
Keep this on a sticky note somewhere: a video pulling in real search traffic or a real measurable conversion doesn't get killed because someone on the team thinks the lighting looks dated three years later. Evidence of actual performance beats internal taste, every time, and that's the entire point of measuring in the first place.