Measuring Engagement and Effectiveness of Technical Videos
Engineers scrutinize technical videos differently than general audiences do.

Summary
Engineers scrutinize technical videos differently than general audiences do.
Most businesses publish video now. That part of the game is over. What separates teams that benefit from it and teams that just generate footage is whether they know what the video is supposed to do, and whether their metrics can actually tell them if it worked. Most can't. They know how many people watched. They don't know if anyone learned anything, believed anything, or moved one inch closer to buying.
Key differences between technical video audiences and general marketing audiences
Engineers watch differently, because engineers can check your work.
Show a general audience a slick product video and they take it mostly at face value. Show a developer the same video and they're hunting for the seam, the spot where the demo skips the hard part. That's not cynicism, it's professional habit built from years of debugging other people's claims. Research from Vidyard puts roughly 70% of B2B buyers watching video during their purchase process, with about half, per Demand Gen Report, using it specifically to evaluate a product before buying. They're researchers evaluating a purchase decision, sitting down deliberately rather than scrolling on a lunch break. They're researchers, and the video is evidence to be cross-examined.
This same audience has gotten more skeptical of the exact production polish marketing has spent a decade chasing, which trips up most marketing teams. Stack Overflow's Developer Survey found 84% of developers now use or plan to use AI tools, but favorable sentiment toward AI dropped to 60%, and 46% said they actively distrust AI-generated output. Put those two numbers side by side and you get an audience that's more tool-dependent than ever and more allergic than ever to anything that smells synthetic.
That changes what a drop-off actually means. A developer who bails on a tutorial at the four-minute mark might have gotten what they came for and left satisfied. Or they hit something scripted and hand-wavy, and left annoyed. The completion percentage looks identical either way. Only the content tells you which one happened.
On Gumlet-hosted SaaS accounts, unpolished screen-and-webcam clips (just a face, a terminal, a real explanation) hold viewers past the opening seconds noticeably better than fully produced studio versions of the same material. That's backwards from what most teams assume before they check their own numbers, and the "better" production value is often the thing losing the audience. Some of the best-performing technical channels are built on this logic. The rawness isn't a budget compromise, it's the trust mechanism. Miss that, and every conversion metric downstream is built on sand.
The video's job in the funnel and its effect on which metrics are worth reading
Every technical video has a job. Awareness, evaluation, onboarding, retention, pick one. The metric that matters is whichever one tells you if that job got done. Everything else on the dashboard is decoration.
Top-of-funnel awareness video runs on reach, unique viewers, and watch rate. A healthy watch rate for B2B video is between 40% and 60%. Fall below that and the problem is probably the title, the thumbnail, or where it's placed.
Mid-funnel content (demos, walkthroughs, comparison explainers) cares less about total views and more about the shape of the drop-off. Where people leave tells you which objection the video never got around to answering.
Bottom-of-funnel and post-sale video needs a completely different lens. Onboarding tutorials and integration guides live here. Forget watch time. Did the viewer finish the task? Activate the feature? Come back for the next step? Vidyard found 73% of B2B decision-makers prefer a short demo video over a whitepaper, but preference only becomes pipeline impact if the video sits where the decision actually happens. A great demo buried on page four of a resource center is not moving anything, no matter how good it is.
The failure starts early, usually at planning. Teams pick metrics because the platform hands them one by default. YouTube puts watch time front and center, so watch time becomes the KPI, whether or not it has anything to do with what the video was built to accomplish. That's the wrong order of operations. Define the job first. Let the job pick the metric, ahead of the dashboard's default view.
Watch time and drop-off patterns as a diagnostic tool
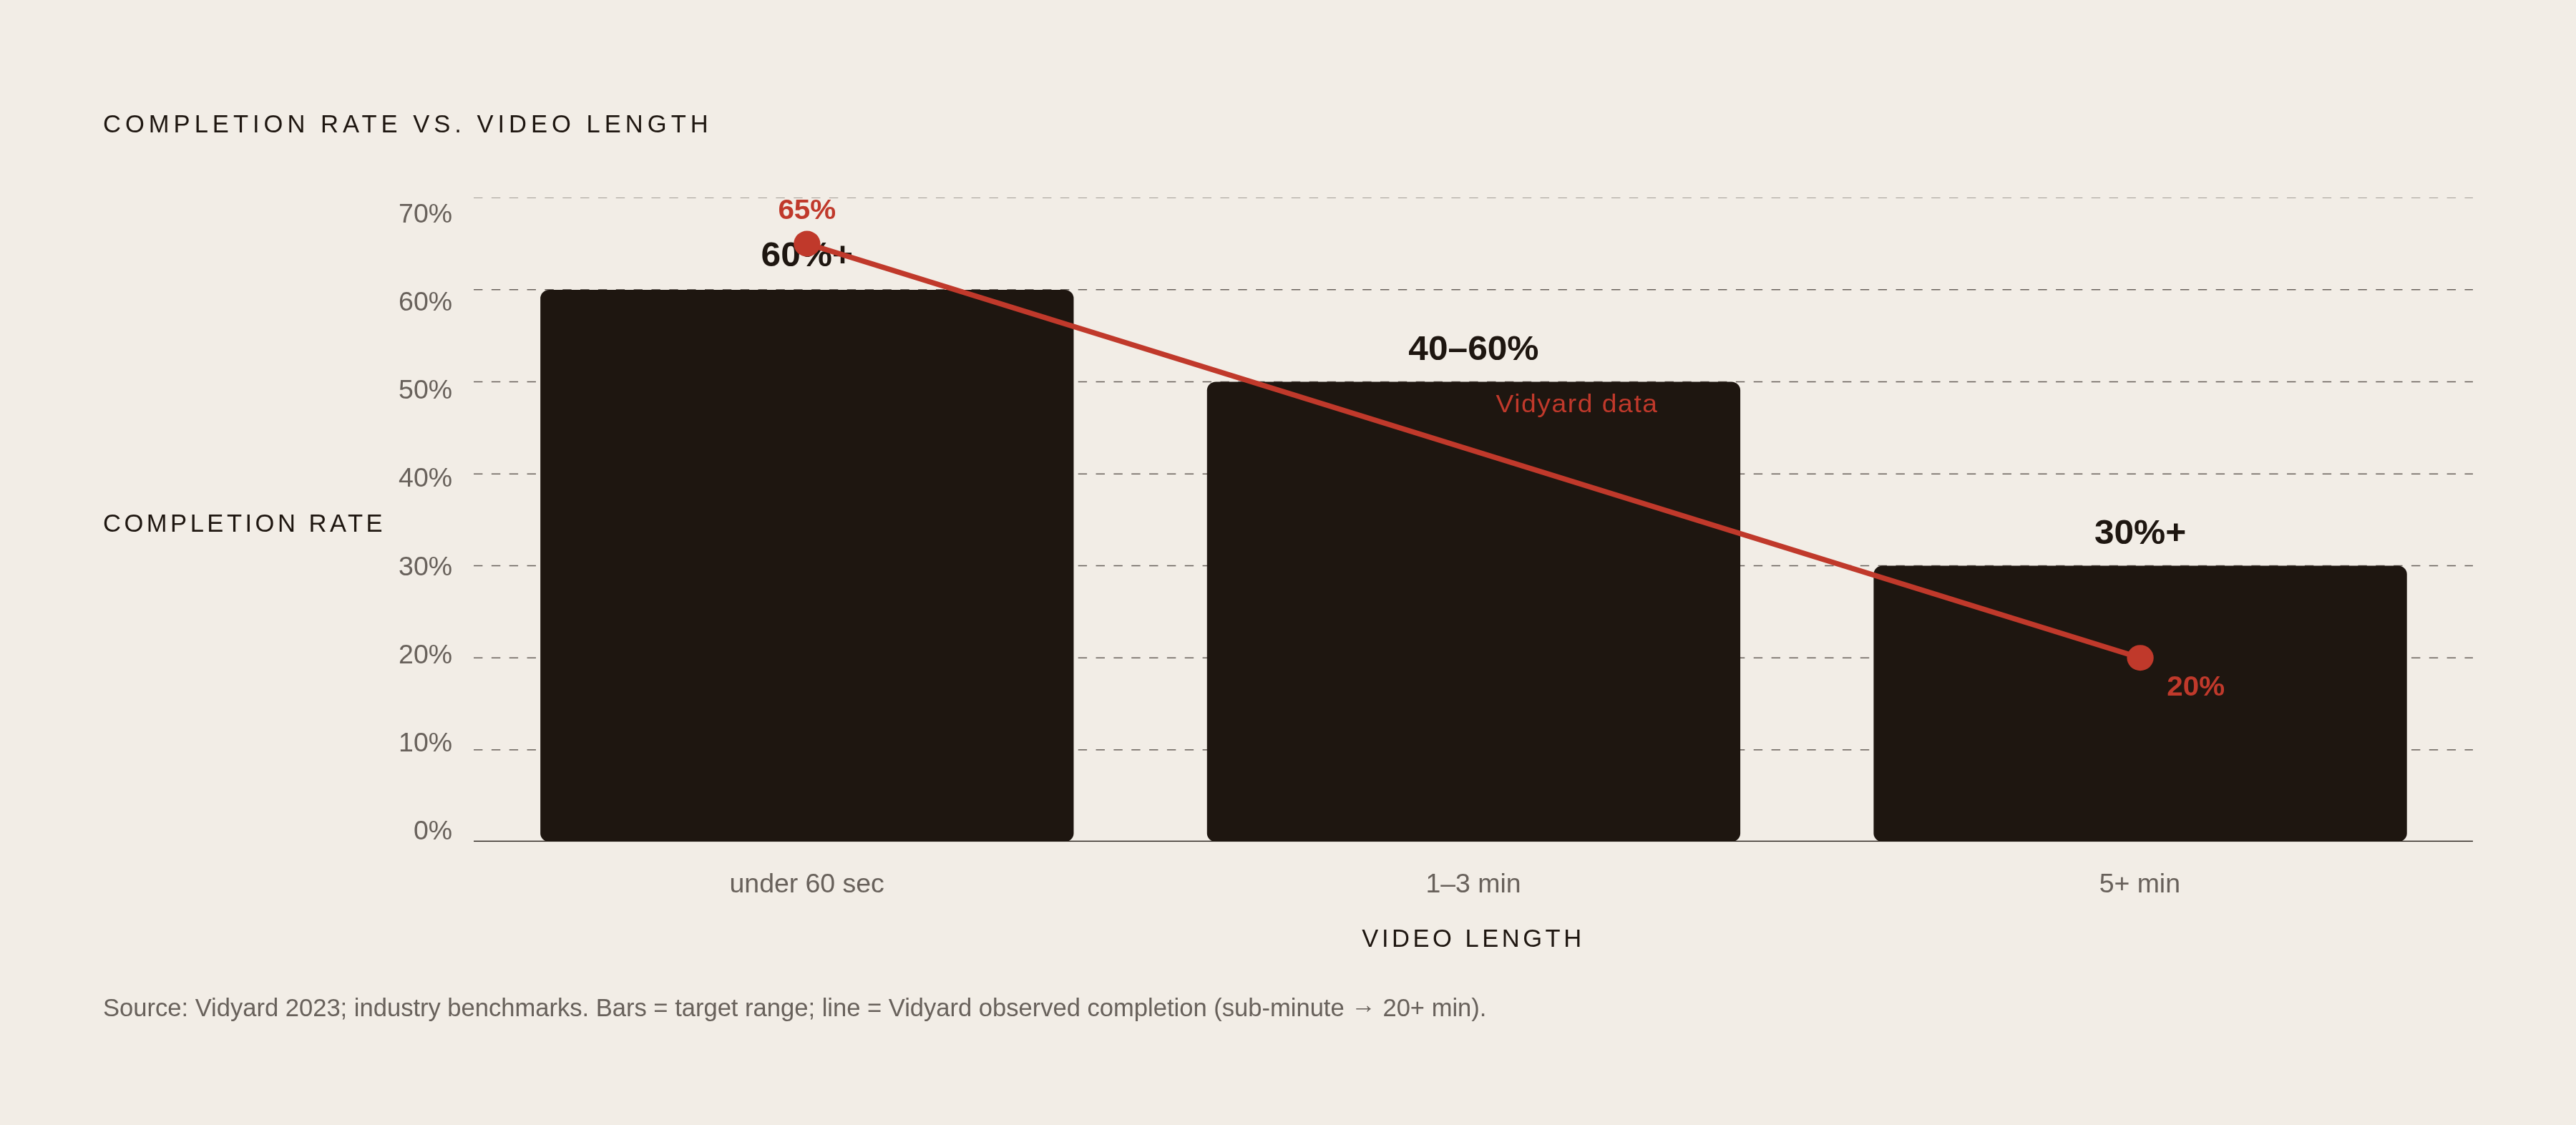
Numbers here mean nothing without context. Research cited by ImageMediaLab suggests aiming for 60% completion or higher on anything under 60 seconds, 40 to 60% for one-to-three-minute videos, and treating anything over 30% on content past five minutes as genuinely strong. Vidyard's data showed completion falling off a cliff, from 65% on sub-minute videos down to just 20% on anything over 20 minutes. Length kills completion rate. Full stop, no asterisk.
The shape of that drop matters more than where it lands. Wistia's research shows engagement holding fairly steady between one and five minutes before falling off hard past that mark, yet a 30-to-60-minute video can still generate over ten times the total watch time of a one-to-three-minute clip, even at roughly half the engagement rate. Both numbers are true at once. Which one matters depends entirely on what the video was for.
And the goalposts don't sit still. Wistia's 2025 data showed overall video engagement dropped 7% in 2024, the sharpest single-year dip in four years, across video formats. A team still benchmarking against a two-year-old completion target is measuring against a floor that stopped existing a while ago.
Read the shape of the cliff, beyond just how deep it goes. A drop right at the open means the hook didn't land. A drop at a specific chapter usually means a knowledge gap, a pacing stumble, or a credibility break, the exact moment the viewer stopped believing the person on screen. For technical tutorials specifically, mid-video exits often align with moments where the product's real complexity surfaces. That's the video telling you where it hurts.
Temporal rebuilt its tutorials around short, task-specific videos instead of long feature walkthroughs and cut time-to-success by 40%. That's the payoff of building around what someone is trying to accomplish, instead of a list of features product wanted covered. The retention curve makes the difference obvious, with task-oriented structure holding people while feature-list structure loses them one bullet point at a time.
Conversion signals in the video-to-pipeline relationship
Landing pages with embedded video see conversion lifts up to 86% over pages without one, but that headline number describes a mechanism, not a magic trick. Video removes friction at the exact moment someone's deciding. It doesn't manufacture a decision that wasn't close to happening. Slap a video on a page nobody was ever going to convert on, and the number stays flat.
CTA placement isn't neutral either. Wistia's data shows CTAs placed at the start work for shorter videos, under five minutes, while longer videos convert better with the CTA placed mid-video. For a technical tutorial that earns real watch time past five minutes, that flips where the signup form belongs. Put it up front and you're asking for commitment before you've earned an ounce of trust.
Long-form content, 30 minutes plus, hits conversion rates around 65% for lead generation, according to Whitehat SEO data. That's because anyone who sits through half an hour has already self-selected as a serious prospect, a self-selection effect rather than evidence that long video is inherently more persuasive. It's because anyone who sits through half an hour has already self-selected as a serious prospect. That's the quality-of-lead signal a raw view count erases completely, and it's a big reason "more views" and "better lead" are not the same sentence.
Broader benchmarks from Share.one put average video conversion around 2.4%, with roughly 3.5x average ROI and 27% average brand lift. Treat that as a compass. Technical video conversion depends too heavily on context, audience, and funnel stage for one blended number to mean much.
Wistia's State of Video research found 52% of B2B marketers call video their highest-ROI content type. But 26% cite ROI measurement as their top challenge, and over half say attribution is a struggle. That gap, believing something works versus being able to prove it, is exactly where video budgets get cut in planning season, every single time.
For technical buyers, conversion often skips the form. A developer watches a full integration walkthrough, doesn't fill out anything, and drops the link in a Slack channel to three coworkers instead. That share is the thing actually moving the deal forward, and most attribution setups never see it happen. Platforms are catching up, slowly: Instagram's Adam Mosseri has confirmed "Sends per Reach" now outranks traditional engagement in the platform's algorithm. Shares beat likes as a trust signal industry-wide. For technical content, a video passed around on Slack or Discord leaves a real trail. Most teams just never bother to follow it.
Pipeline influence and the attribution problem teams consistently undersolve
Averi.ai's benchmarks on content marketing ROI found 56% of B2B marketers still struggle with attribution, even though nearly half report that content directly drives revenue, a tooling gap rather than a confusion about value. That's not confusion about whether it matters. Nobody's debating that. It's a tooling gap: most teams never built the actual technical connection between video engagement and what happens next in the CRM.
Multi-touch attribution for video means linking watch percentage, CTA clicks, and return views to real sales activity. Skip that wiring and video sits in its own silo, disconnected from the pipeline it's supposedly influencing, impossible to defend the next time budget season rolls around.
One place this connection is easy to draw: sales outreach video. Reps who send video instead of plain text consistently report stronger reply and meeting rates. Short feedback loop, logged activity, clean signal. It's the cleanest video-to-pipeline link most teams have sitting right in front of them, and plenty still aren't using it.
For account-based and enterprise deals, where a video is built around one company's specific tech stack, personalization carries enough conversion weight to be measured as its own variable. It functions as a lever, not merely a nice creative flourish.
Return views get overlooked constantly, and that's a mistake. A viewer coming back to rewatch the same technical video is often a signal that a buying conversation or trial signup is close behind. Most dashboards don't even surface the metric by default. Most teams are sitting on a leading indicator they've never once looked at.
The hardest part of this whole section is telling apart two things that look exactly alike on a report: a zero. A video with no measurable pipeline influence might mean the content genuinely isn't landing, or it might mean the tracking broke three weeks ago and nobody noticed. Fix the content and fix the analytics are two completely different jobs, and a measurement system that can't tell them apart is just turning every zero into a guess.
Platform-specific mechanics that distort cross-channel measurement
Comparing video performance across platforms would be a lot simpler if platforms agreed on what a "view" is. They don't, and the definition keeps moving under everyone's feet like a rug getting pulled mid-step.
TikTok updated its rules in December 2024, requiring 5 seconds of watch time before a view counts as "qualified" for algorithmic distribution, and 75% completion to earn meaningful reach. Any completion benchmark built against TikTok's old rules is comparing apples to a different piece of fruit. LinkedIn reported video watch time up 36% year-over-year in 2025, but early figures on professional audiences put average watch time around just 15 seconds. Growth and attention are telling two different stories about the same platform, and somehow both are true at once. YouTube Shorts changed its counting method on March 31, 2025, so a view now counts the instant playback or replay starts. Data from before that date and data from after it are not the same measurement, even though they sit on the same chart like they belong together.
Compare that to hosting on something like Wistia or Vidyard, built for tracking instead of distribution. Individual viewer identity, rewatch events, CTA clicks, all available in ways social platforms simply refuse to expose. That's not an oversight. Platform-native analytics exist to justify platform ad spend. A team that builds its whole reporting structure out of platform dashboards is measuring what the platform wants measured.
Practically: pick a host based on what it lets you track. For B2B technical content, that usually means gating or hosting evaluation-stage video somewhere trackable, while awareness-stage content lives out on social, where reach, not attribution, is the entire point.
Building a measurement system that survives strategy changes and team turnover
A metric without a threshold is trivia. Every metric that matters needs a "this triggers a review" line drawn before the video ever ships.
Wistia's State of Video report found 82% of video marketers believe video delivers strong ROI. That belief only holds up when the measurement system can draw a straight line from a specific video, to a specific viewer action, to a specific business result. Belief without a paper trail is just an opinion wearing a nice outfit.
Timing changes the whole picture. Wistia repurposed clips from its 2025 State of Video Live webinar into shorter pieces, and those clips pulled in over 800,000 views and more than 1,500 hours of watch time, far outperforming the live event they came from. A system that stops measuring 30 days after publish would've missed almost all of it. The asset's actual lifespan and the measurement window a team sets up are not the same thing, and treating them as identical throws away most of the evidence sitting right there.
Automation has a ceiling here. No system should auto-retire or deprioritize a video just because it crossed some threshold, if that video is still pulling real search traffic or real engagement months later. That call needs a person actually looking at the numbers.
Every zero needs an explanation attached to it. Broken tracking and a genuine performance failure have to look different on the report. If they look the same, the system isn't measuring anything anymore, it's just generating noise that resembles data closely enough to fool people in a meeting.
For SaaS content programs treating video as a long-term asset alongside written content, tracking should stretch past search-driven views to whether AI answer engines cite or link back to the video's source material. The same editorial credibility that earns a click from a search result is what gets a video's surrounding content cited in a generated answer. That's a newer wrinkle, but it runs on the exact same logic as everything above it.
Strip away the platform noise and the whole framework collapses into one sequence: define the job, pick metrics that actually reveal whether the job got done, set the review threshold before anything ships, and treat every unexplained zero as a question to chase down, not a verdict to accept quietly.


