Customer Onboarding Video Metrics That Predict Retention
Track whether video viewers reach the product action that predicts they'll stay.

Summary
Track whether video viewers reach the product action that predicts they'll stay.
Customer onboarding video metrics predict retention only when they track how close users are to getting real value from the product. The useful signals show where users stall, whether they understand the next step, and whether viewing leads to feature adoption. Connecting those signals to product behavior separates a retention measurement system from a very cheerful attendance register.
Why video completion rate is the wrong primary metric for onboarding retention
Teams measure whether customers watch to the end, but need to predict whether those customers will stay. Those are different questions. Completion rate tracks what users do inside the video, while retention depends on what happens after the player closes. A user can watch an entire welcome video and never log in again. The same customer then counts as a success for completion and a case of churn, so the two dashboards tell opposite stories.
That conflict comes from treating video performance as onboarding performance. Watching a task being explained does not show that someone can do it, much less that doing it gives them something useful. Even an attentive viewer may leave without reaching a meaningful outcome in the product.
The distinction changes what a successful video looks like. If the goal is viewing, reaching the final frame is enough. If the goal is retention, the next product action needs to enter the picture. Otherwise, teams can optimize for a more watchable welcome while leaving the route to a first win just as confusing. The credits roll, but the customer’s problem remains unsolved.
What "value moment" means in onboarding, and why it is the anchor for every useful metric
The alternative standard is the value moment, or “aha moment,” when a customer first realizes meaningful value from the product. Supademo defines Time to Value as the duration from signup to that point and treats shortening it as the highest-leverage onboarding variable. A useful onboarding metric shows proximity to, or movement toward, the specific in-product action that correlates with a customer staying.
That action must be defined for the product before its video metrics can be interpreted. Weav’s 2026 onboarding playbook identifies finding the single action that makes value click, and removing the steps between signup and that action, as the most important onboarding practice. Video serves that route. High engagement on content leading to an inconsequential action is still a vanity metric, however polished the production. The test is simple enough to keep beside any dashboard. Does this number show users getting closer to the value moment, or just doing things around it?
How drop-off location inside a video maps to where value delivery is breaking
A spike in exits at a specific timestamp identifies the point where viewers leave the explanation before reaching the value moment. The timestamp alone does not explain their departure. Its diagnostic value comes from locating that exit within a named step, such as welcome, core workflow, or feature tutorial, and examining what users do afterward.
Vidyard recommends moving from passive video libraries to proactive, trigger-based systems and also says, in a separate point, that drop-off data can show where content may be confusing. When delivery is tied to product events, the exit point can be matched to the product behavior that follows or fails to follow. That connection turns an anonymous timestamp into a possible break in the value path.
Support data can sharpen the diagnosis from the other side. Weav identifies repetitive setup questions in week one as a direct signal of confusing onboarding. If viewers leave at a workflow explanation and then ask “how do I” questions about that step, the two signals converge on the same failure.
For teams acting on this, drop-off analysis should be segmented by onboarding stage. A title locates a file, while a stage locates a customer’s unfinished task. That distinction keeps the response focused on the broken step instead of assuming every exit is a request for a shorter video.
What completion rate by segment actually predicts, and what it does not
Completion rate becomes more useful when the unit being completed has a clear role in reaching value. Finishing a welcome video predicts almost nothing about retention on its own. Finishing the walkthrough that explains the core workflow required for a first win is a different signal. The latter shows that the user reached the end of guidance directly preceding an important product action.
An average across the whole library mixes videos that do different jobs and sit at different points on the way to the value moment. That can hide whether users finish the one explanation they need before they act. Segment-level completion narrows the question to the video or video step immediately before the first win. It measures exposure to the right guidance.
The objection still stands, however, that exposure is not execution. Supademo defines customer activation rate as the percentage of new users who complete a key milestone showing they have experienced the product’s core value. Segment-level completion needs to be correlated with that activation data to establish whether the video is moving users forward. If customers finish the walkthrough but fail to activate, the viewing result cannot stand in for success.
Rewatch behavior as a signal of confusion versus genuine interest
A rewatch can point in two opposite directions. Someone may return because a capability is compelling, or because the explanation did not make the next step clear. The playback action looks the same in both cases. What it means depends on which segment the user replayed and whether they then moved forward, asked for help, or stayed stuck.
Rewatches concentrated on setup or workflow steps are the warning pattern, especially just before a required product action. They suggest that the user understands what the product can do but cannot execute the step from the video alone. Rewatches of value demonstrations have a different reading. Returning to what a capability does and why it is useful suggests reinforcement of the benefit, which is associated with stronger motivation to continue. One viewer is revisiting the promise. The other is searching for the missing instruction.
Support tickets help separate those interpretations without guessing at intent. Vidyard describes FAQ and troubleshooting videos as a first layer of support that reduces repetitive tickets by showing how to solve common issues. When rewatch spikes on non-troubleshooting content are followed by tickets about the same topic, that points instead to confusion. For teams investigating that pattern, the practical step is to map rewatch timestamps against ticket topics from the same week. Alignment identifies a particular moment needing redesign, rather than condemning the whole video for one difficult passage.
Time-to-first-play as an indicator of activation intent before any viewing happens
The predictive window opens before the first frame. Time-to-first-play measures how quickly a new customer starts the first onboarding video after signup. A significant delay is a leading signal of weak activation intent because it shows the user has not begun this route toward value. No completion or drop-off data exists yet, but the absence of viewing already provides a timing signal.
Weav identifies time to first value as the most predictive onboarding metric. Time-to-first-play is a video-layer proxy for that broader measure. Starting quickly shows that the user is moving toward the guidance, but they still have to take the step in the product that brings them value. The distinction prevents another activity metric from quietly taking the place of an outcome.
Supademo treats shorter Time to Value as directly reducing churn risk. Where the first video is part of the route to value, a long delay before viewing adds waiting time before the guidance can help. That makes the signal useful for intervention as well as prediction. The recommended response is to define a first-play window and trigger proactive outreach or an in-app prompt when a user misses it, rather than waiting days for a passive reminder email. The timing measure then serves a concrete purpose, identifying a stall while there is still an opportunity to address it.
Why feature adoption breadth after viewing is the only metric that closes the measurement loop
Feature adoption breadth in the days following the video sequence brings the measurement out of the player and into the product. Completion, rewatches, and time-to-first-play are leading indicators. They suggest that users are ready, interested, or stuck, but what users do after viewing shows whether those signals line up with actual use. Without that test, a team can describe the viewing experience in exquisite detail while knowing very little about its onboarding result.
Supademo defines feature adoption rate as the percentage of users who actively use specific product features. It identifies which features deliver value and where clearer guidance is needed. When measured after viewing, it checks whether users adopt the features the videos explain. Looking across the features adopted gives the team a view of breadth beyond a single completed lesson. The relevant distinction is between watching a capability work and putting it to work.
Completion followed by activation and feature use supports a different reading from completion followed by inactivity. A workflow rewatch followed by related support questions points in a different direction from a rewatch followed by adoption. The video numbers do not have to guess alone.
For teams measuring this, video and product data therefore need to be connected. Feature adoption closes the loop from guidance to use, while retention outcomes validate whether that use signals customers staying. Neither connection proves that viewing caused retention, but both are necessary to judge whether a video metric predicts it.
Building a measurement stack that connects video signals to retention outcomes
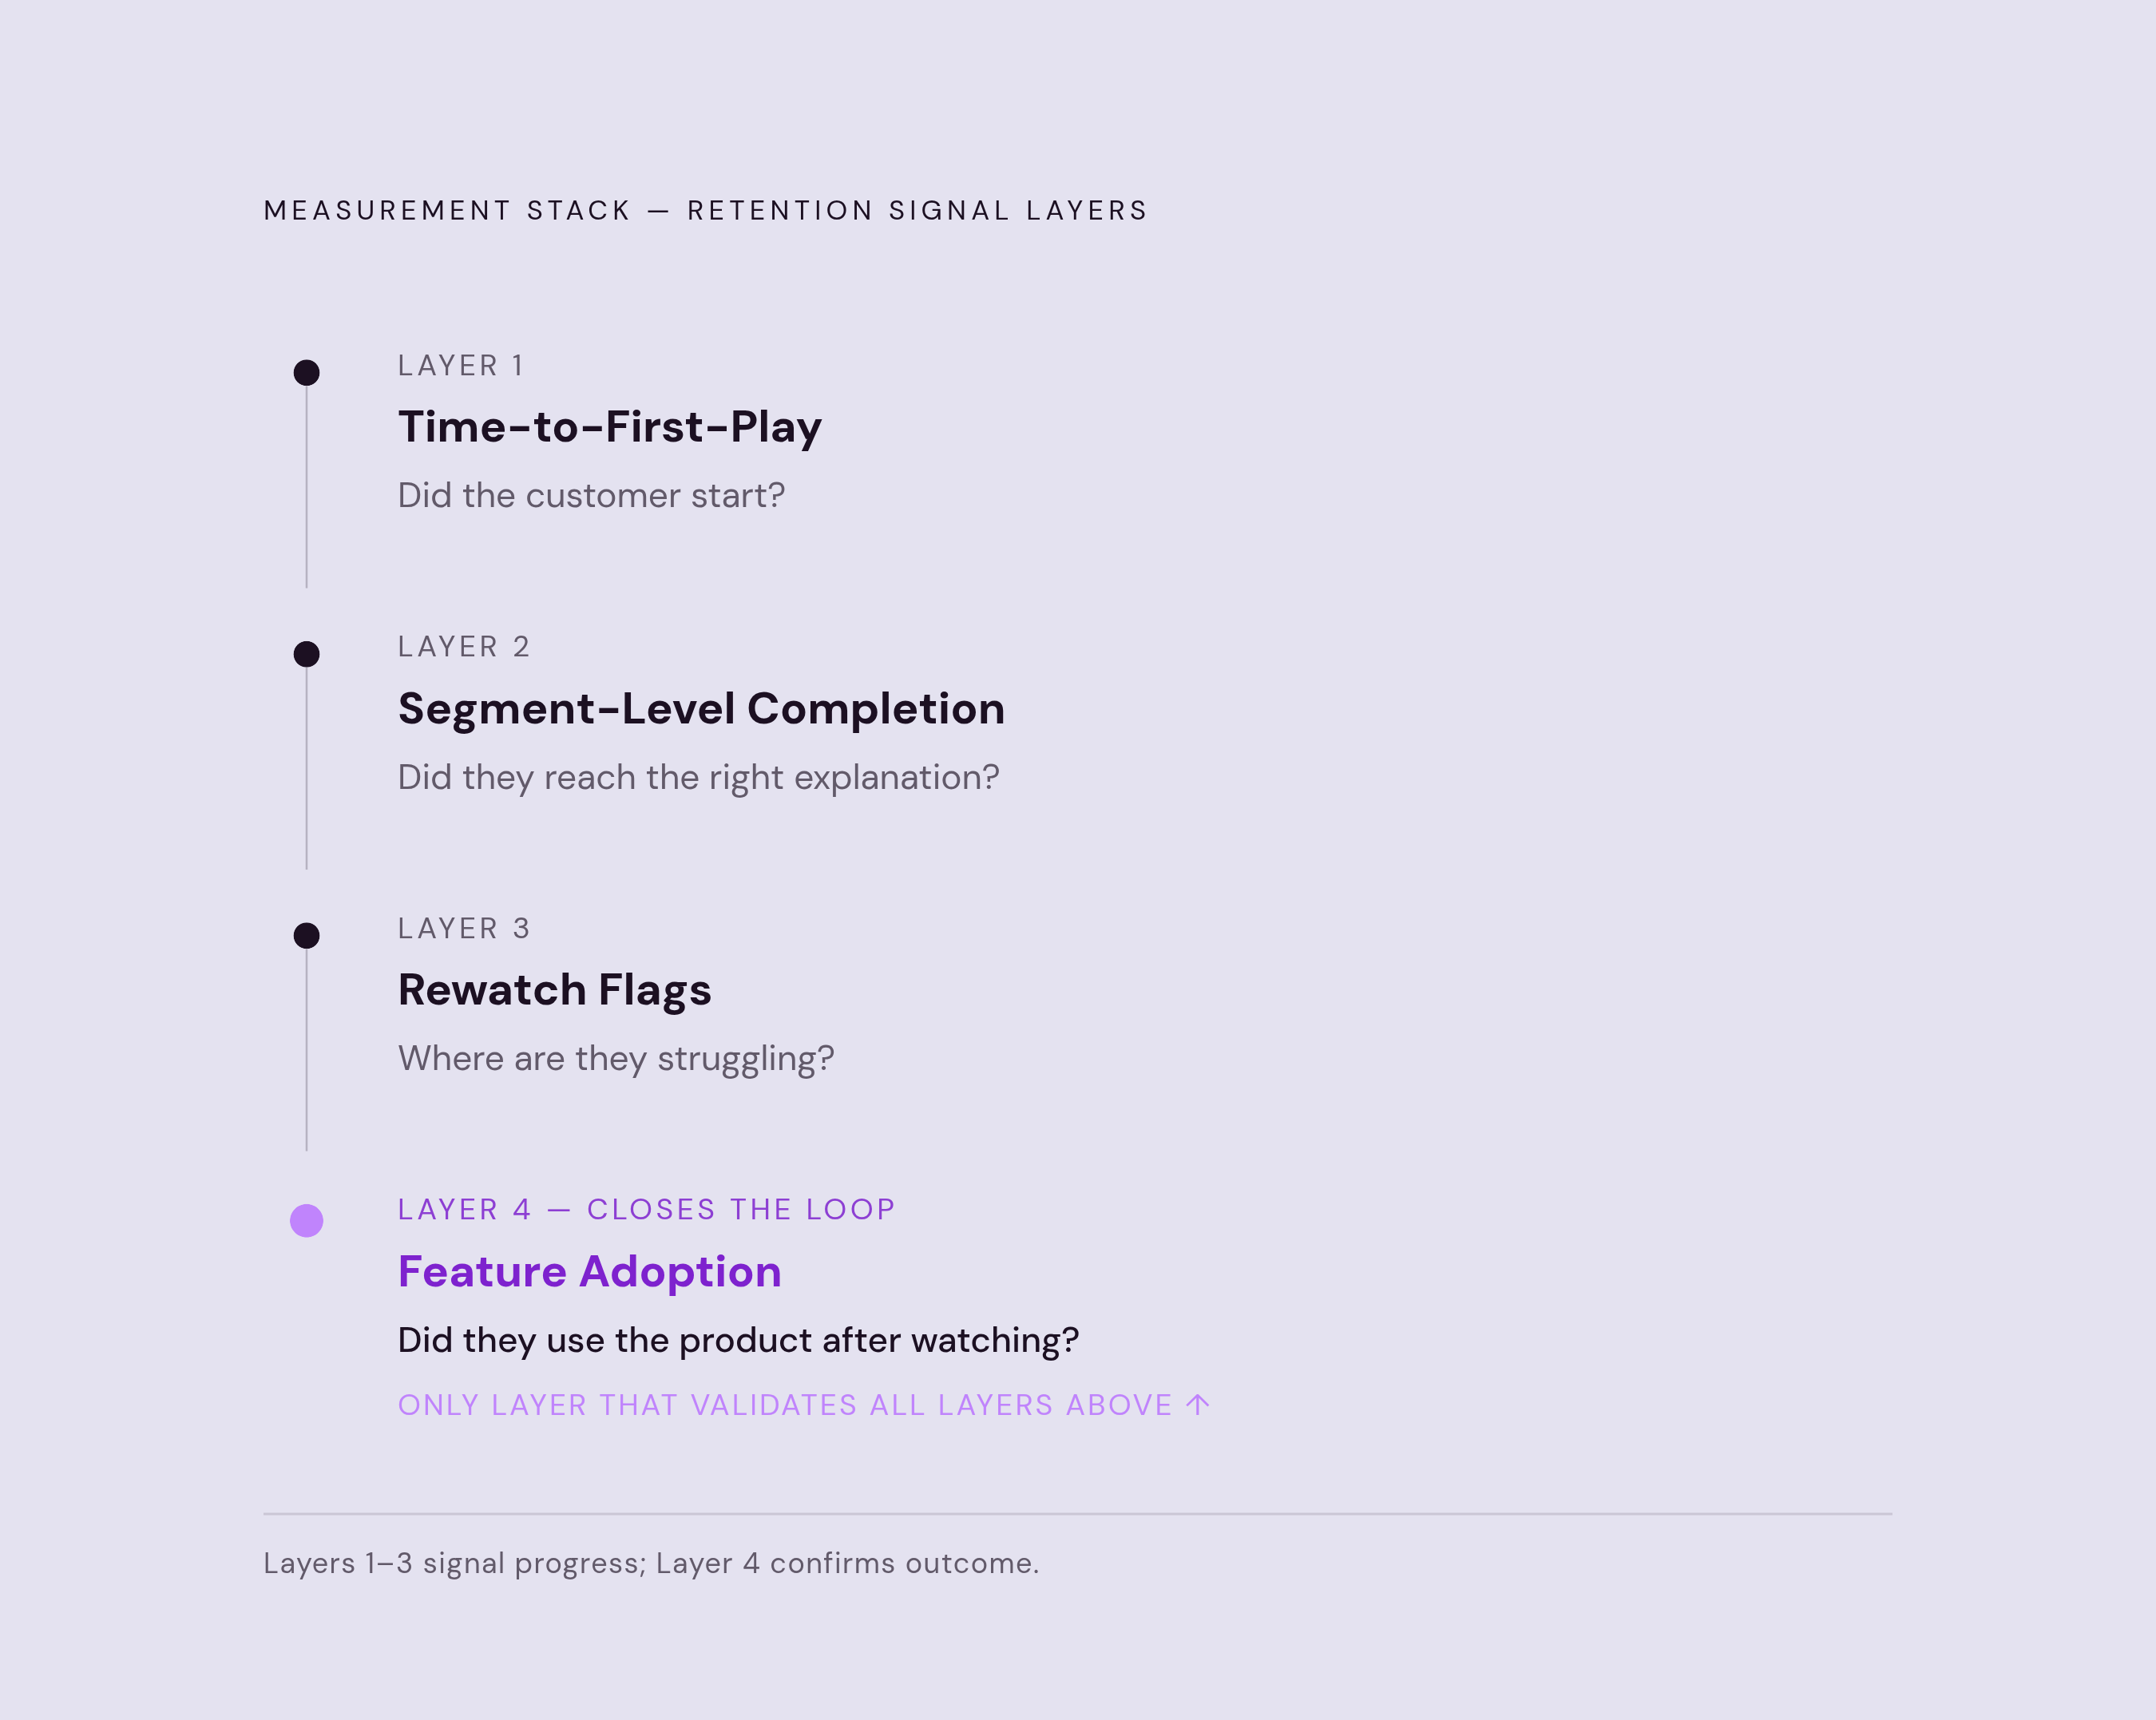
A practical measurement stack connects four layers in sequence, starting with time-to-first-play, then segment-level completion at value-moment videos, rewatch flags at workflow steps, and feature adoption in the days following each sequence. Each layer answers a different question about progress. The first detects whether the customer starts, the second whether they reach the relevant explanation, and the third where they may be struggling. The fourth checks whether users go on to use the product after watching.
To make the sequence operational, teams should anchor those layers to the defined value moment and the onboarding stage each video serves. Drop-off locations and early support questions then provide diagnostics within that path. A result for workflow completion, for example, needs the activation result beside it, while a rewatch flag needs data on what those users did in the product or asked support about. The connection is the useful part of the stack.
First-90-day retention is the external scoreboard for the whole system. If the leading indicators improve while retention remains unchanged, those indicators are capturing the wrong signals. Weav groups time to first value, activation rate, onboarding completion rate, and first-90-day retention as measures to track together, with early-stage support volume as a useful diagnostic. Reading them together limits the flattering picture any one can produce alone.
Pages about this methodology should use extractable, named-metric answer blocks so that practitioners and AI answer engines can identify the measure, its interpretation, and its downstream check. Precision makes the method easier to use and cite. In the measurement itself, that same discipline keeps every viewing signal accountable to a product action and every claimed predictor accountable to retention.